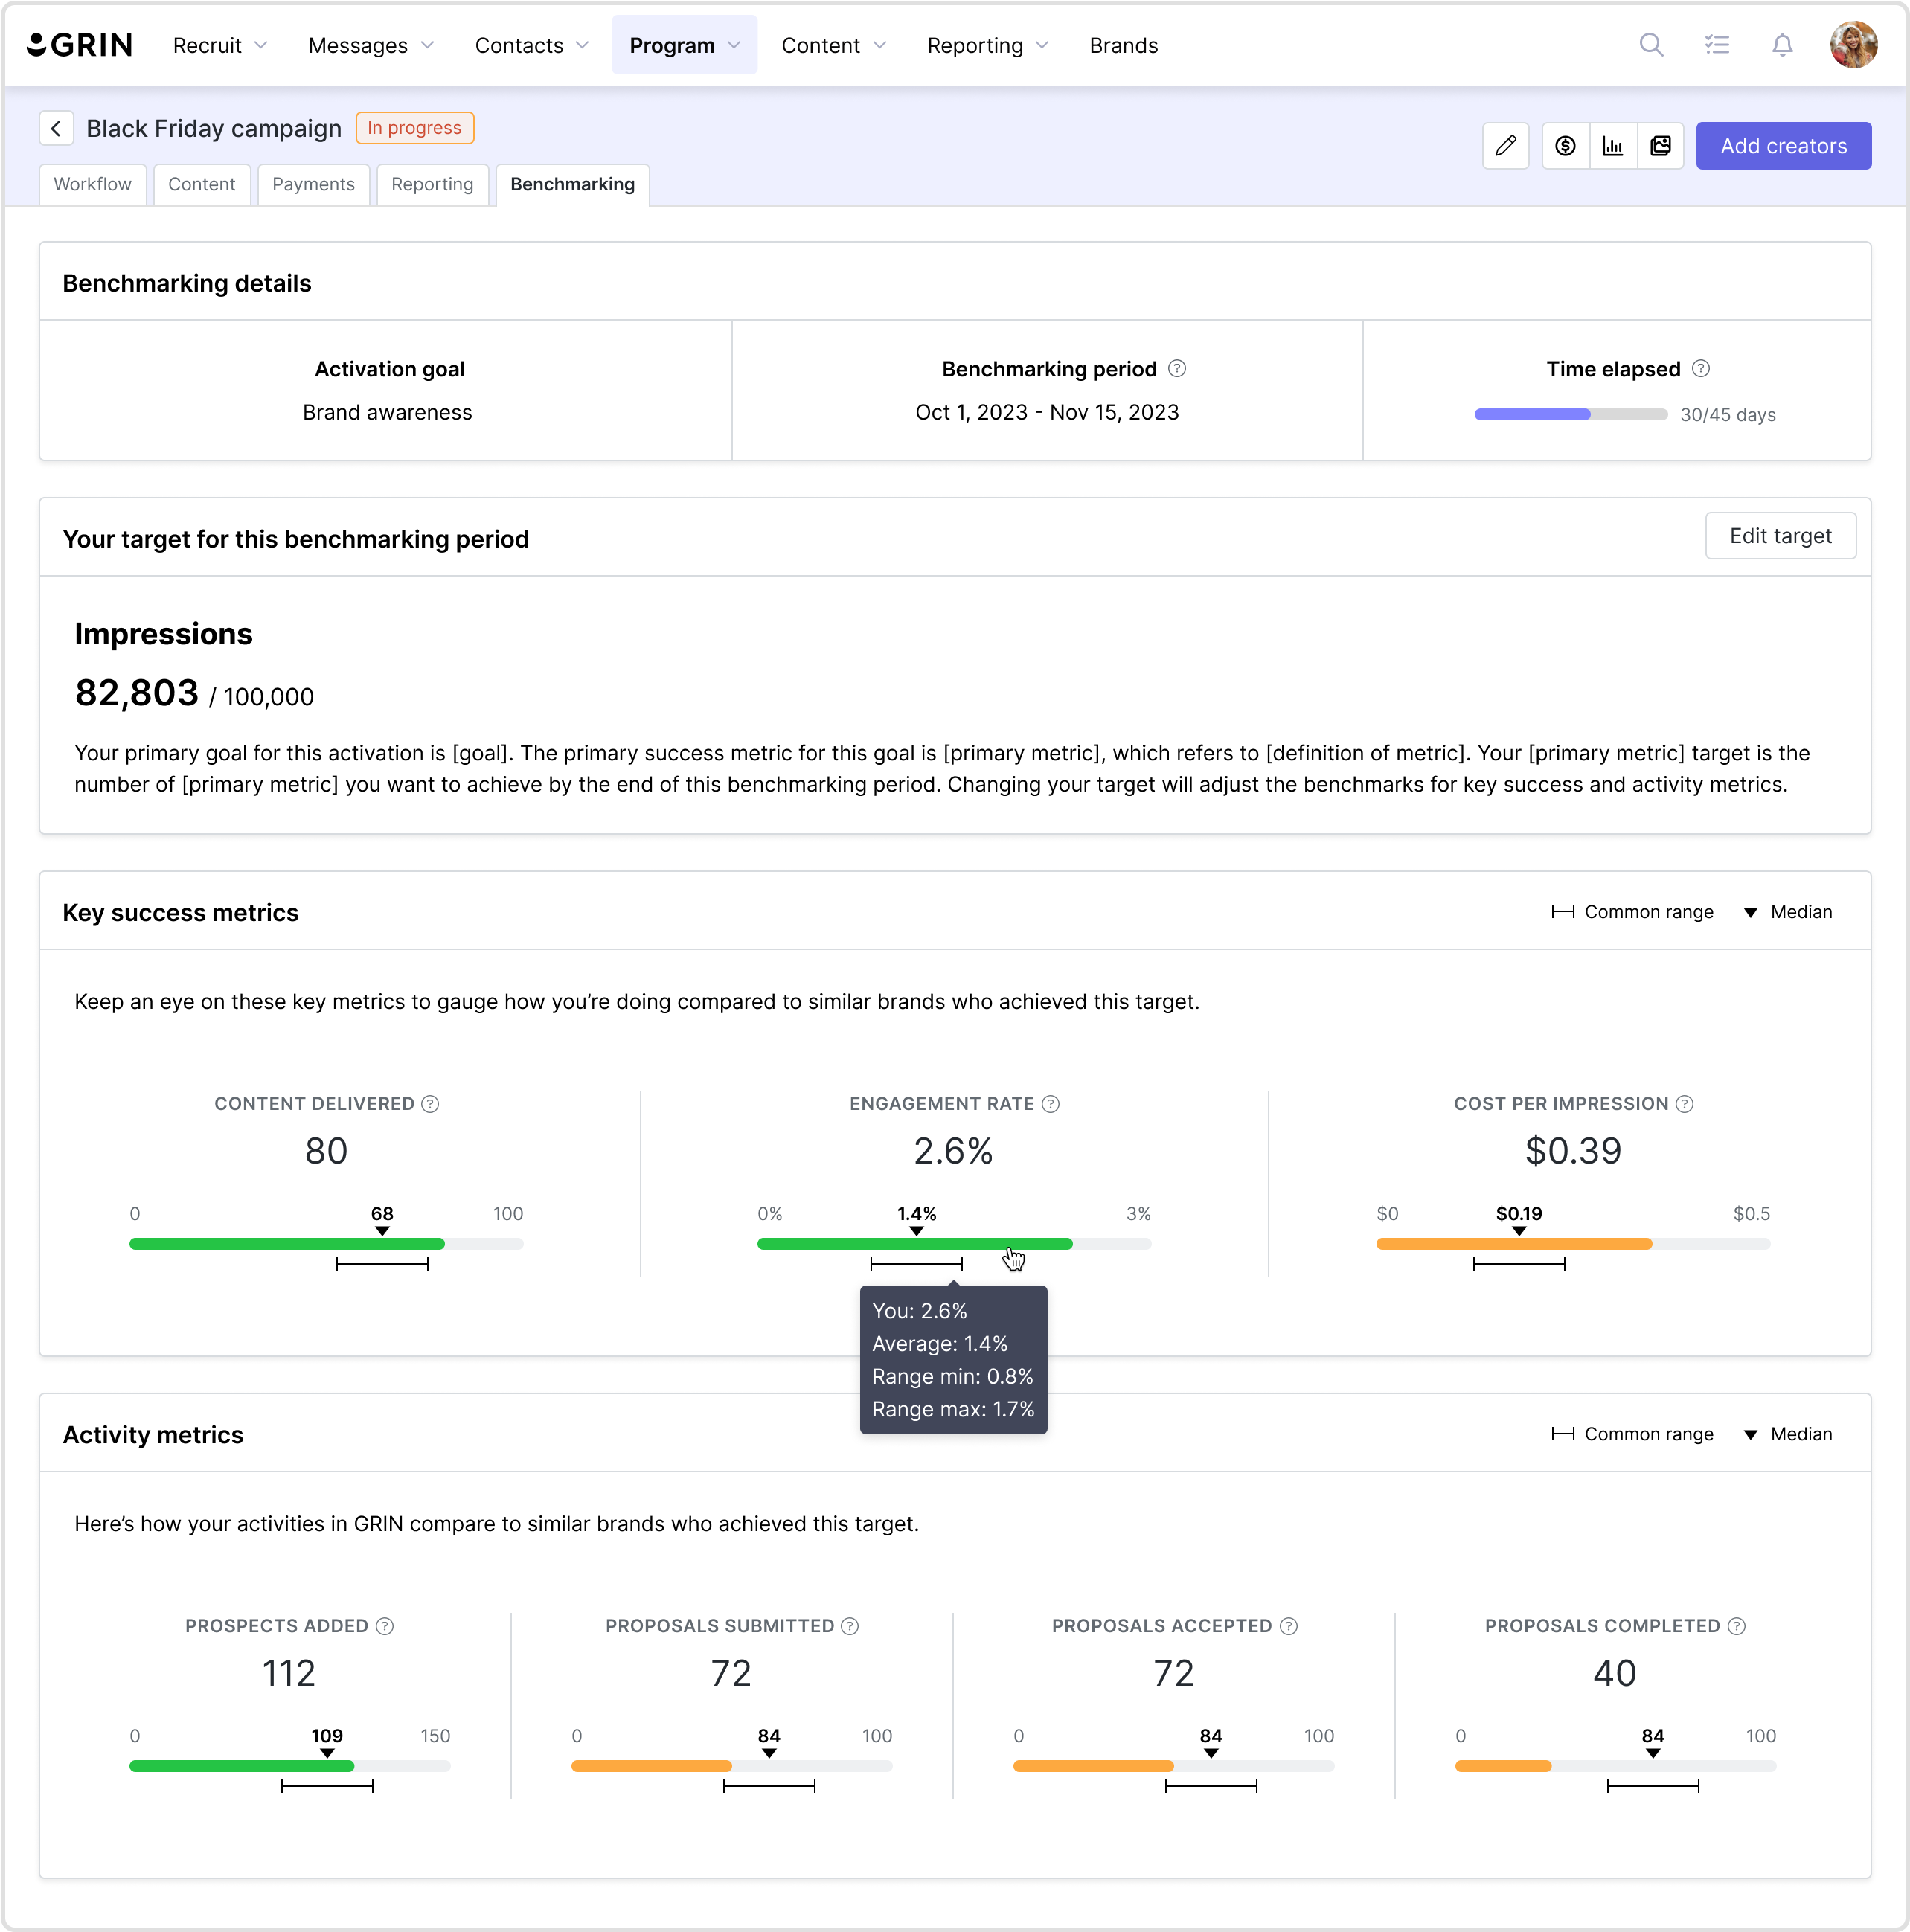
GRIN Reporting Suite

From simple dashboards to powerful report builders, I designed GRIN's reporting suite to support users across a spectrum of expertise. No matter how experienced you were, you were able zoom in and out of data to reach a level of reporting that was just right for you.

← Back to Projects

Project Goals

Surfacing just enough data

GRIN is a robust tool that generates and stores tons of data. Common feedback we heard was that users didn't know how to use the data or what to make of it. It was clear that when it came to reporting, we needed to ease users into the vast sea of information through smarter dashboards views and giving them options to dive deeper.

Flexible data manipulation

For power users (and typically Enterprise customers), there was a need for more robust and flexible reporting. There were so many ways that a user might need to see the information and their needs changed on a regular basis. We needed a way to allow users to slice data however they desired while also helping to manage all of that data in a user-friendly way.

Insights and analysis through AI

At the end of the day, reporting needs always boiled down to a few core needs: to share progress with managers and inform their influencer marketing strategies. This was especially difficult for newer marketers who didn't know what KPIs to look for and how to interpret results. We sought to make this easier by using AI to uncover insights to users.

User Needs

A major pain point for our users (and influencer marketers in general) is the need to prove the value of influencer marketing to managers. Though it's been around for a few years, it's really just starting to take off and become a serious strategy for businesses. Without ready access to their program data, even seasoned marketers had trouble convincing higher-ups that it's worth the investment.

Another point of frustration for users was knowing what to report on and what the data meant. Understanding goals and outcomes influencer marketing took a level of expertise and experience in the space to do. The goal of Reporting Suite was to provide users with good, accurate data that was easy to access, as well as guidance around what that data was saying.

Dashboard & Report Builder

To address the holistic reporting problem, I designed a simple program dashboard that pulled together the most important data to gave the user a quick look at their progress. I also designed a report building tool that gave users access to every single datapoint related to their program. The report builder is a paid addon that generated over $100k ARR in the first year of its release and has consistent daily use from our users.

$100k+ ARR

within first year of release

256 DAU

(Daily average users)

Active usage from 76%

of user base

  • Activations Hub: I redesigned the primary landing page for Activations to surface data that users previously had to dig around for. This page now provides quick insights into how they're spending on their program as a whole, as well as what returns they're getting.

  • Reporting Dashboard: This dashboard gave users a quick, holistic view of their program. If they needed more information about a particular piece of their program, they were able to dive into the data with Report Builder.

  • Report Builder: this powerful tool gave users access to every piece of data available in GRIN. With Report Builder, users could slice data however they wanted to build their own reports that could be used externally.

Goalsetting & Benchmarking

To help users understand their performance, we came up with a set of proprietary benchmarking data to give users something to measure themselves against. With this feature, users are able to measure their performance and key success metrics against brands who were similar to them based on program goal and size. This gave users a realistic sense of how they were performing and clear goals to aim for.